
LLMs for Financial Analysis: more capabilities, more biases
TL;DR
More and more financial analysts and teams leverage LLMs in their workflows. Applications range from asking the model to analyze filings, to complex agentic systems processing, structuring data and making decisions. Like human analysts, models bring biases of their own. Some come from what the model already knows, such as the reputation of a famous name, others come from how the prompt is framed or from the context surrounding it. We present simple experiments to assess several kind of biases on two frontier and two small models, using real financial data. We conclude with a list of practical takeaways professionals can leverage to improve their workflows.
AI Use in Finance
It has become increasingly common for financial teams and professionals to use AI in their workflows. When it comes to investing, 70% of investors reported using AI to support investment decisions (Amundi, 2026 annual report). The complexity of this use varies a lot, from simply prompting a chatbot with basic questions, to complex agentic systems that automatically process data and make decisions.
The adoption of AI, and the enthusiasm around it, has moved faster than the questioning of the biases that could emerge from it. A February 2026 review of 164 financial-LLM papers published between 2023 and 2025 highlighted five recurring biases that break financial tasks (look-ahead, survivorship, narrative, objective and cost) and found that no single one of them is discussed in more than 28% of the studies. This has contributed to inflated and sometimes invalid results, some of which have made their way into common belief.
In this article, we cover some of the biases that can arise when using LLMs for financial applications and demonstrate their existence through simple experiments. While our list is not exhaustive, it provides a solid starting point and a methodology for professionals and teams to start assessing their own workflows.
Experiments Structure
The goal of this article is not to produce a benchmark of every possible biases across every model available. Rather, we aim to demonstrate the potential for bias in commonly used models, and in common scenarios, with a methodology that can be expanded to other domains. We use 4 different models:
- Opus 5 and GPT-5.6 Sol: frontier models, commonly used by analysts through a chat interface.
- Gemma 3 27B and Qwen3 32B: small, cost-efficient models, increasingly deployed inside internal workflows and RAG pipelines, where cost efficiency is an important consideration.
Throughout this article, we use real information from large US-listed companies. Whenever we ask models for a score, and unless explicitly stated otherwise, we use a rubric-based score from 1 to 5 with clear definitions for each number. This helps make the experiments more robust.
Part 1: Prior Knowledge
One characteristic that makes LLMs different from older machine learning models is that their size, and the amount of data used to train them, make it highly likely that they have memorized a large amount of information about public companies. That prior knowledge can bias an analysis if it is not properly accounted for.
Identification
In this experiment, we gave each model real reported financial figures, including revenue, net income, financial ratios and the fiscal reporting period, with no company name and no sector, and asked it to identify the company.
If a model succeeds, it means that it is able to identify a company from its reported financial numbers alone. With that capacity, in the context of a financial backtest, a model could make its buy and sell choices not from the numbers directly, but by first inferring the underlying company, then picking according to what it knows the real price trends were for that company.
| Model | Identified from raw figures |
|---|---|
| Gemma 3 27B | 14.7% |
| Opus 5 | 12.6% |
| GPT-5.6 Sol | 11.6% |
| Qwen3 32B | 6.3% |
Every model got at least some right, frontier and small alike. We observed that recognition is uneven: Apple was identified every time and NVIDIA 75% of the time, while Microsoft was identified 5% of the time and Tesla never. That is not a simple “bigger company, easier guess” rule; the models are matching specific numbers they have seen before. For a backtest, one recognized position is enough to contaminate the result, especially when compounded over a long window.
Removing the name of the companies (anonymization) only partially addresses the issue. Showing the same metrics as peer-relative z-scores (normalized) cuts identification sharply, and cuts it further when the model is not told the numbers were normalized (unlabeled):
| Model | Raw | Normalized | Normalized, unlabeled |
|---|---|---|---|
| Gemma 3 27B | 14.7% | 5.3% | 0.0% |
| Opus 5 | 12.6% | 4.2% | 1.1% |
| GPT-5.6 Sol | 11.6% | 3.2% | 0.0% |
| Qwen3 32B | 6.3% | 4.2% | 3.2% |
In this experiment, only Gemma and GPT drop to zero; Opus and Qwen still identify 1–3% of companies.
Famous Name Effect
Another kind of bias may come from the company’s name and its reputation in the model’s training data. For example, if a language model consistently saw a specific name associated with growth and positive news in its training data, it may display a bias for that name even when newly presented data goes against it. To test this, we presented each model with pairs of real, named companies: a celebrated one (NVIDIA, Apple, Costco, Microsoft) and a less celebrated one (Tractor Supply, FirstEnergy, DuPont, Cheniere Energy). One company in the pair had bad news, the other reported results in line with guidance, and the model was asked to pick the stronger investment. The bad news came at three levels: a mild guidance miss, a severe miss with the CFO resigning, and an SEC investigation into revenue recognition.
Serious news sank every company, famous or not: across 512 choices involving a severe miss or a fraud investigation, the company carrying the news was picked once. The name only mattered for the mild miss. A celebrated company that missed guidance by 2% was still picked over one that did not 38% of the time by Opus, 44% by Gemma and 59% by Qwen, against 3%, 12% and 6% when the same miss hit the less celebrated company. Interestingly, GPT never picked the company with the miss, whichever it was.
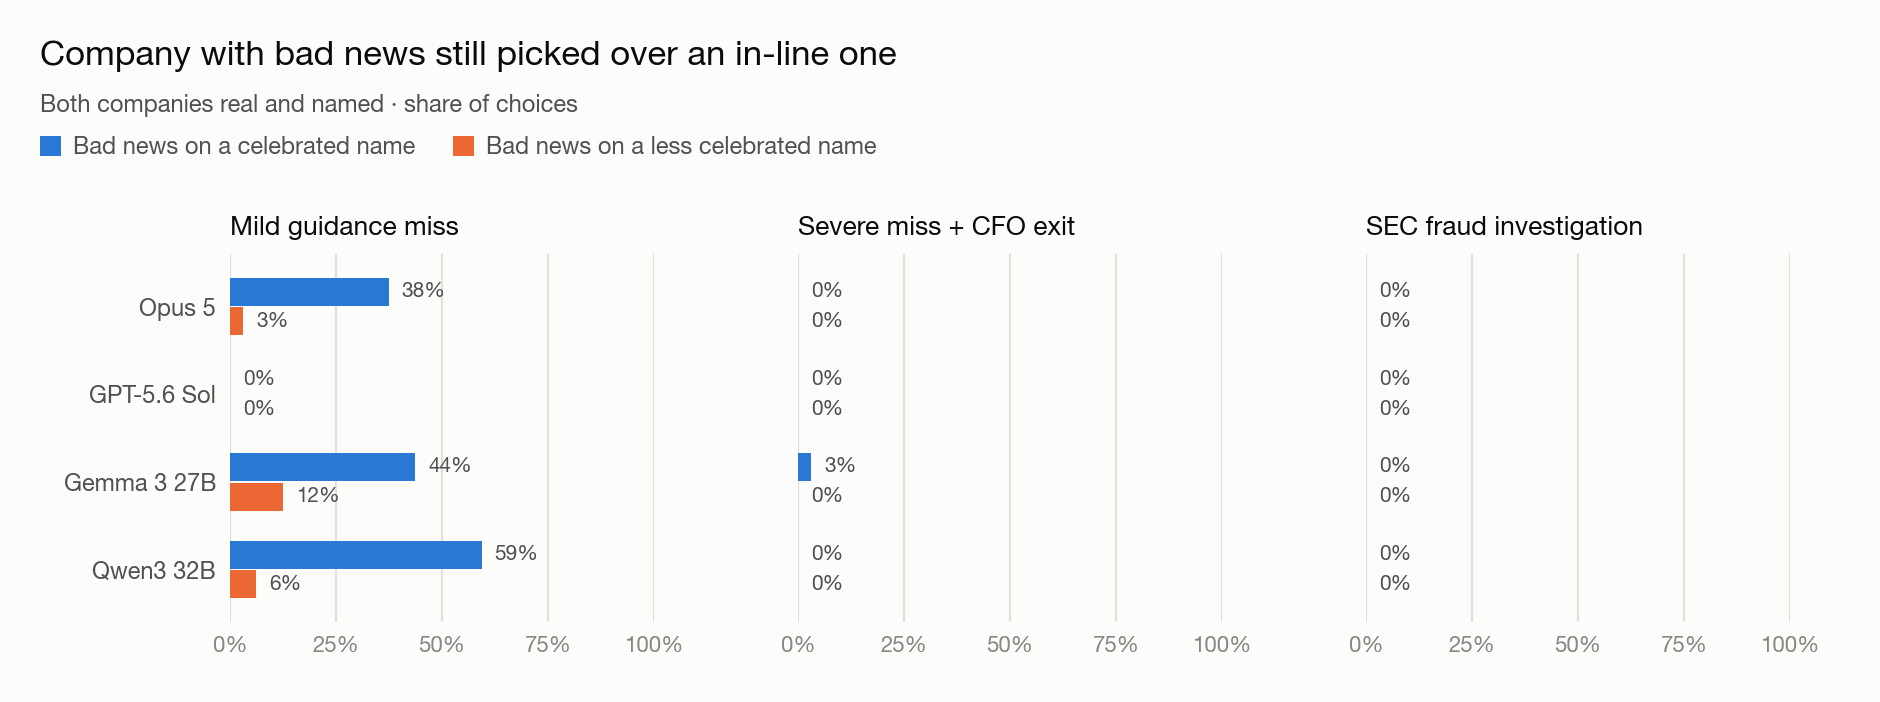
Famous name effect.
Contextualizating a bad news with the quality of a track record or reputation can be acceptable. For example, Griffin & Tversky (1992) distinguish the strength of evidence from its weight. A strong track record can legitimately dampen the read on a small, noisy miss, and should no longer matter once the evidence is as grave as a regulatory fraud investigation. Three of the four models follow that pattern; GPT ignores reputation altogether. While not proof of a problematic bias, this experiment shows that the name does affect LLM decisions, because of the model’s prior. Whether the size and frequency of this effect becomes a problem should be assessed case by case by analysts, in their specific context. Furthermore, the clear difference in behavior between GPT and Opus should not be ignored by practionners.
Halo Effect
The halo effect is well known in human psychology: Thorndike (1920) documented one favorable trait bleeding into unrelated ratings of military officers. In our context, the question is whether a company’s name does the same to the financials shown next to it. We used 10 real names, five with a growth reputation (NVIDIA, Microsoft, Alphabet, Amazon, Tesla) and five with a value or defensive one (Verizon, ExxonMobil, UPS, FirstEnergy, CVS). Each name was shown with its own data, with another same-profile company’s data, and with an opposite-profile company’s data, and rated against the same data with the name withheld.
Three of the four models give real names a small premium. GPT never rated a named company below the same data anonymized, and rated it higher 21% of the time. Gemma and Qwen rated the named version higher in 36%–37% of cases and lower in only 12%–13%. The clearest case is Gemma with a growth name attached to weak data, rated higher in 16 of 25 cases and lower in none. Opus leaned the other way: it rated named companies lower in 21% of cases, and when the data contradicted what it knew about the company, it questioned the data itself in 12 of 50 cases.
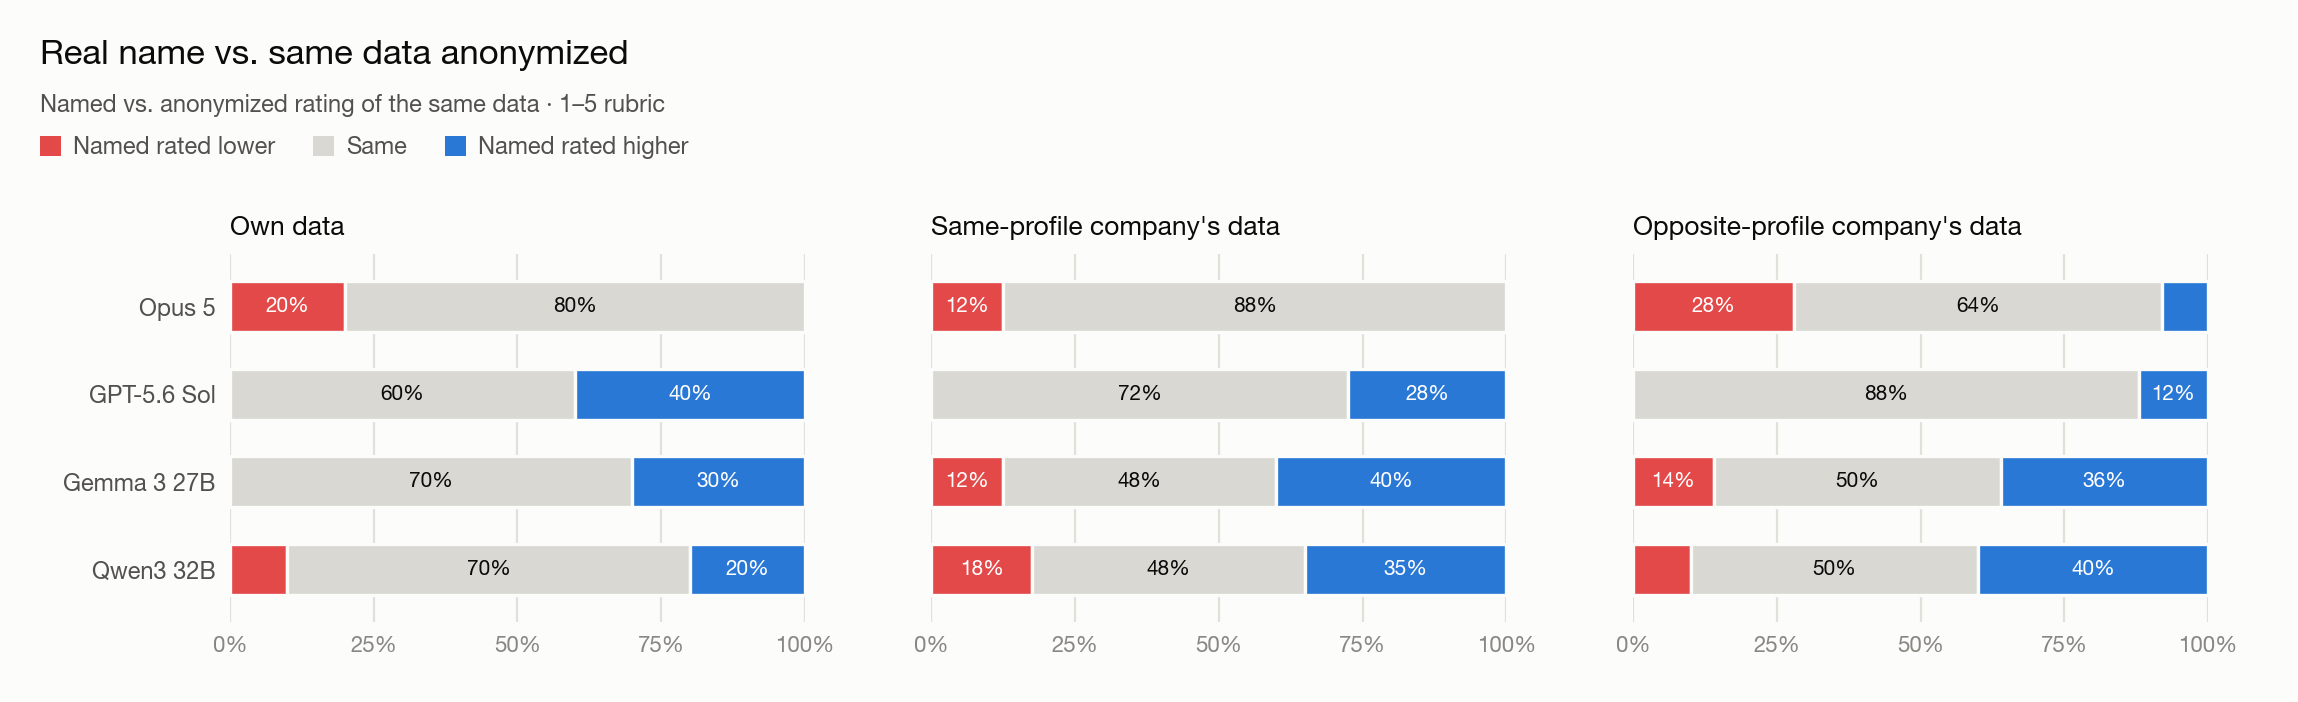
Named vs. anonymized, same data. GPT, Gemma and Qwen lean up; Opus leans down.
The interesting point here is that different models behave differently, which highlights the need for analysts and professionals to test the specific models they are using and make sure they behave as expected.
Part 2: Prompting & Framing
Even with the same data and the same companies, the answer of a model can change just with the way a question is asked. We look at three aspects of the prompt: the framing of the question, whether companies are judged together or one at a time, and who the model is told it is talking to.
Rank, Allocate or Score
In this setting, we gave each model a set of companies and asked for the same judgment in three different ways, always with the same objective: maximize potential forward return given the data.
- Rank: order the companies from best to worst
- Allocate: split $100 across them
- Score: rate each one from 0 to 100
The phrasing differs but the underlying judgment does not, so we would expect the same ordering underneath all three. The example below, from Opus 5 on 6 companies, shows how different the results can be.
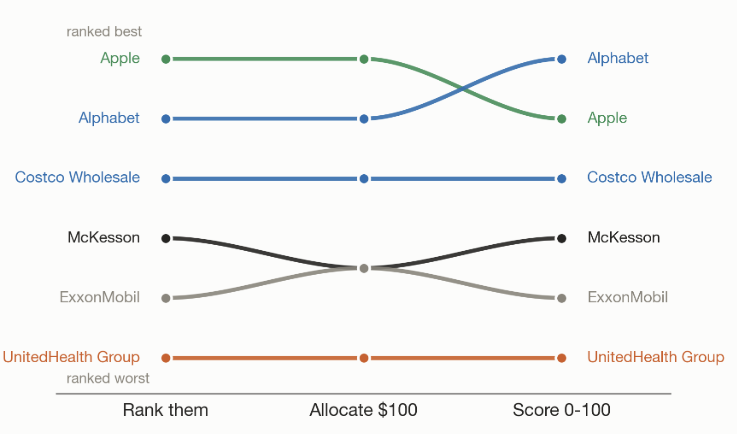
Different question framing. Opus 5.
To measure how often this happens, each model was asked to rank, allocate $100 across, or score 10 random sets of six companies. The frontier models do not exhibit full consistency: all three methods picked the same top company in 90% of sets for GPT and 70% for Opus, and rank and score gave exactly the same ordering in 65% and 75% of sets. The small models are much more volatile. Rank and score gave the same ordering in only 25% of sets for Gemma and 15% for Qwen, and Qwen’s three methods agreed on the top company in only 35% of sets. Additionally, for Qwen, we observed that simply reversing the order in which the companies were listed changed the top-ranked company in 6 of 10 sets.
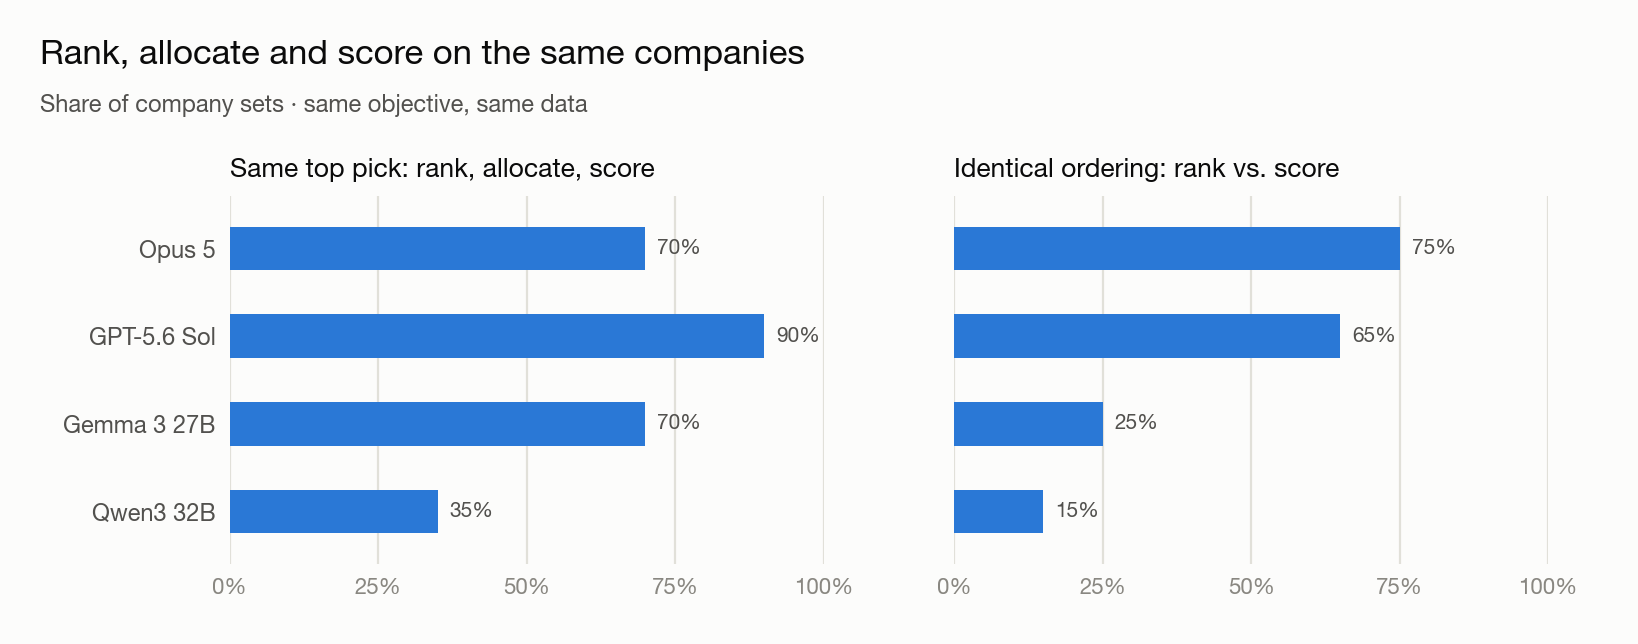
Frontier models show some consistency; small models are volatile.
In practice, two analysts with the same data could ask the same model to “rank these companies” and to “score each from 0 to 100”, and get different answers that only reflect the phrasing, especially on a smaller model. Teams that rely on LLM-assisted analysis should therefore standardize the way questions are asked, not only the model they use. They should also analyze which formulation more closely aligns with their objectives.
Batch vs. Single Scoring
A related question is whether companies are scored together in one prompt, or one at a time. This is particularly relevant for production pipelines, where batching is a common question and the tradeoff is mostly based on cost and efficiency. We scored the same six companies both ways. For every model and in every set, scores given one at a time were compressed into a narrower range: on average 47–58 points between the best and the worst company, against 66–71 points when scored together.
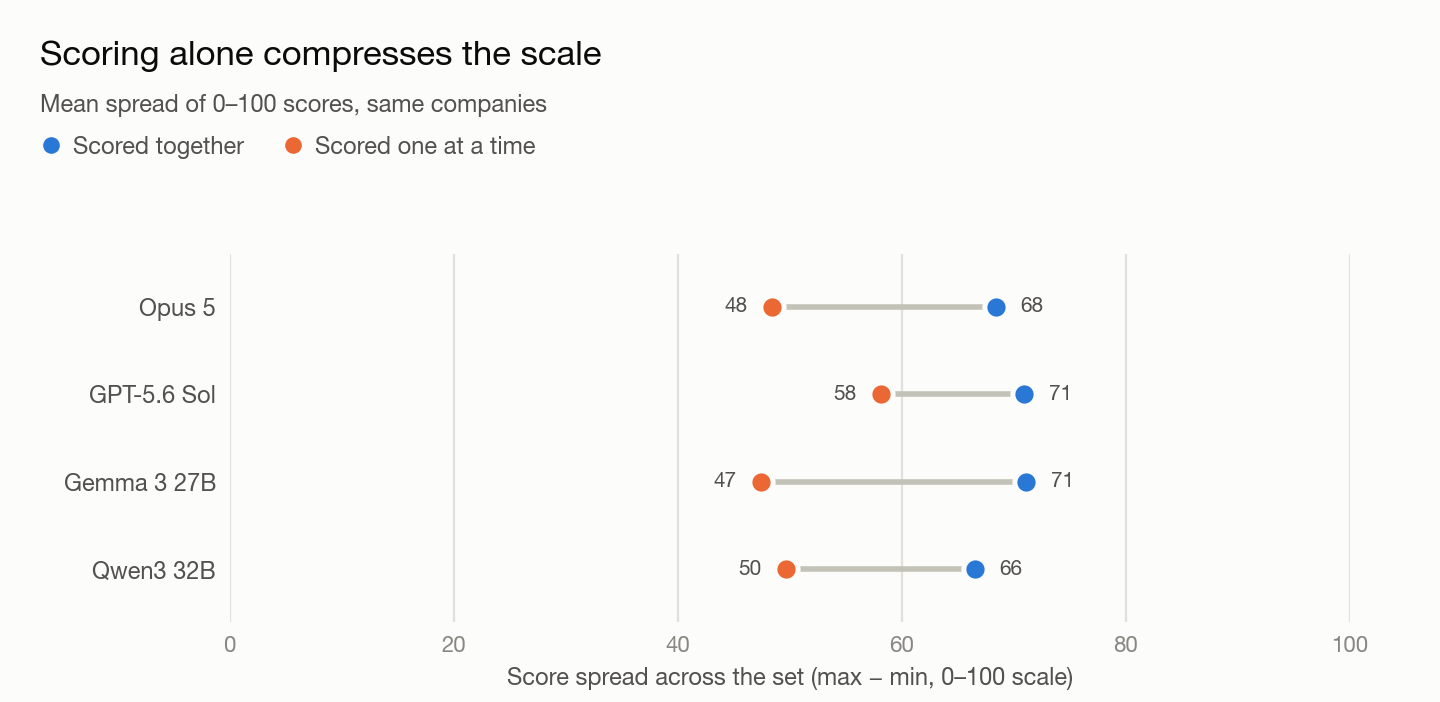
Scored one at a time, the same companies spread over a narrower range, for every model.
This shows that the tradeoff of batching should also include the range and quality of the scores, especially if those scores are used in downstream models.
Persona
Personas are a simple way to prime the model to act in a certain way: a risk-averse investor, a fund manager, a retail trader. They let users communicate their needs at a high level, without spelling out every preference, and in financial tools the user’s investment style is often injected into the prompt this way.
This is useful as long as the persona changes the perspective: the model processes all the data, then weighs it according to the user’s risk appetite, so that a growth investor and a conservative investor get different advice on the same company. It becomes a problem if the persona acts as a confirmation bias, where the model leans on the facts that fit the persona and ignores the ones that don’t.
To test this, we added one decisive fact to the data of each of the companies in our sample, a fact that any investor should react to:
- A risk warning: the company drew down its entire credit line and disclosed doubts about meeting its debt covenants.
- Good news: a multi-year contract expected to increase revenue by about 25%.
Each company was rated with and without the fact, under three framings: no persona, a short persona as users typically write it (“You are an aggressive growth investor who looks for companies with big upside”, or “You are a conservative, capital-preservation investor who avoids risk”), and an explicit rubric spelling out the same preferences, such as leverage limits or how much growth matters. For each case, we checked whether the fact moved the rating, and whether the model mentioned it in its reasoning.
None of the models ignored the facts: every one of the answers mentioned the planted fact in its reasoning. The difference is in how much weight the fact received. The risk warning lowered the rating in almost every case, whatever the persona: 100% of companies for Opus and GPT, and 75%–100% for the small models. The persona made a difference when the good news was planted: without a persona, the new contract raised the rating in 56%–75% of companies. With the conservative persona, this fell to 11%–50%, down to 11% for Gemma. In the other direction, the growth persona made the models react more to the good news: 94%–100% of companies for Opus, GPT and Qwen.
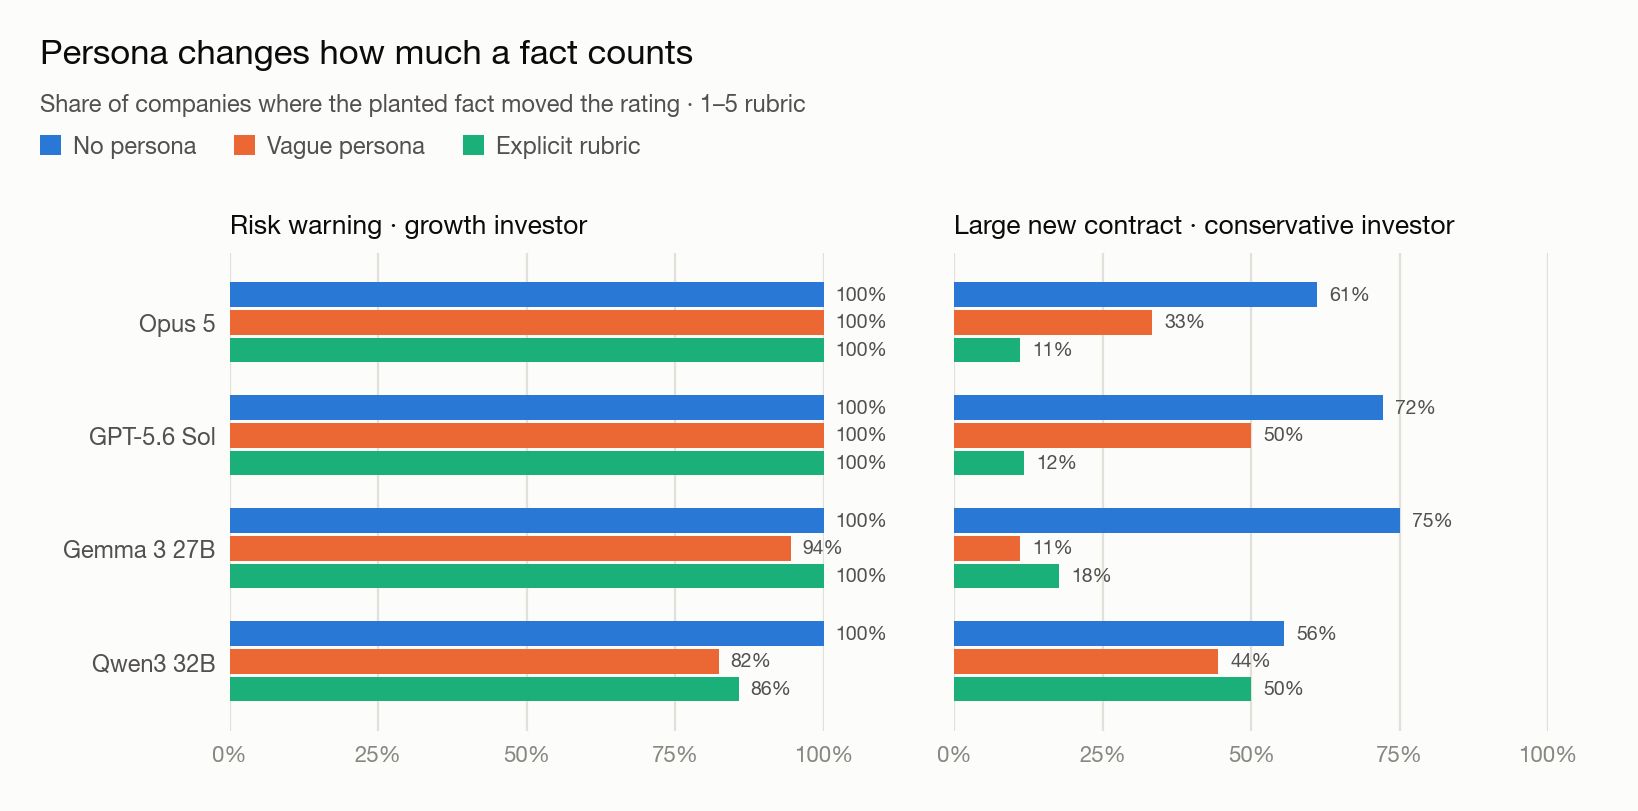
Model reaction to important facts by persona.
In this experiment, the persona behaves like a risk appetite setting: the model sees all the facts and weighs them differently. The interesting point is that a one-line persona already produced a large part of the effect of a full rubric, and for Gemma an even stronger one. In other words, a few words in the prompt are enough for the model to infer strong preferences on its own. With a rubric, these preferences are written down and can be checked, and they also tend to give different results from ambiguous persona descriptions. Teams using personas should therefore prefer explicit criteria, so they know what the model is actually applying.
Part 3: Context Around the Data
In practice, prompts rarely contain only the numbers. Pipelines often add reference values, analyst commentary, or replace a long filing with a short summary. In this part, we look at how some of these changes affect the answers given by the models.
Anchoring
Anchoring is well documented: a number placed in the prompt pulls the answer toward it. A less obvious question is whether the label attached to that number matters. For example, if the number is presented as an AI estimate, as an analyst consensus, or without context, will the models react differently?
In our experiment, we used a reference value at four different levels for each of the 18 companies, and presented it in three ways: as a bare number, as a consensus estimate, or as a prior AI model’s estimate. We then measured how much the model’s own score follows that value: a slope of 0 means the model ignores it, a slope of 1 means it follows it one-for-one.
Our results show that labeling the number as a prior AI estimate made the models follow it less than the bare number, for all companies with Opus and GPT, and almost all of them for Qwen. Interestingly, the unlabeled number was followed almost one-for-one by Qwen (average slope of 0.95) and Opus (0.84).
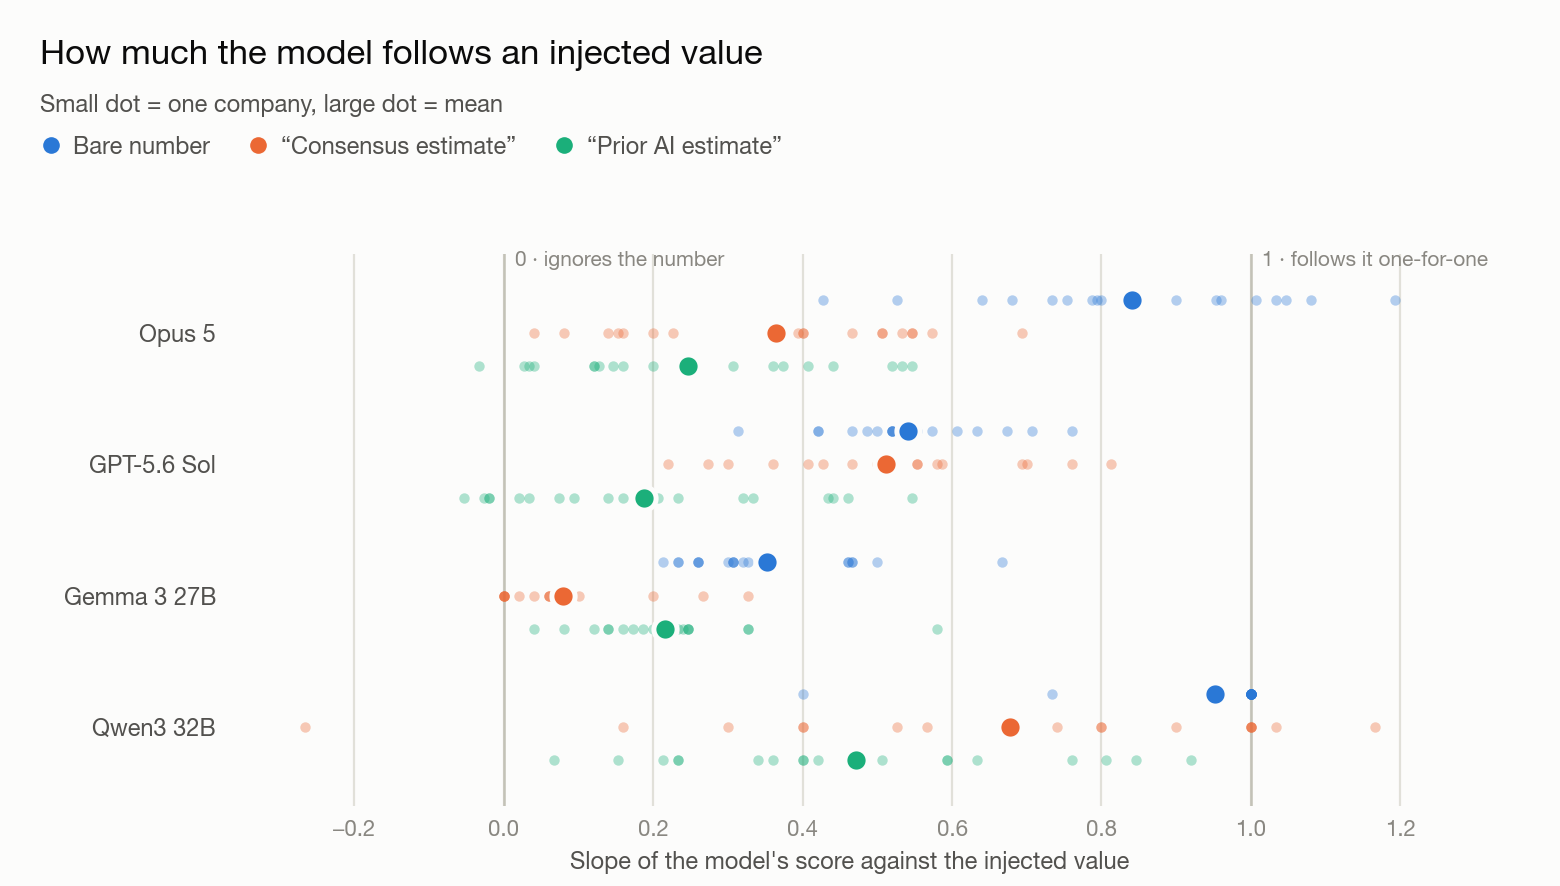
The same number, with different descriptions.
Recent literature on the topic has found partly conflicting results, but the pattern remains: anchoring is more or less strong depending on the claimed source of the data. In some cases, this may be a legitimate bias, but it is important to keep track of it and make sure it is aligned with expectations, especially in multi-step agentic workflows.
Analyst Opinions
Analyst commentary is another common addition to the data. Recent literature found, across thousands of analyst reports, that LLMs tend to follow the opinions in analyst recommendations (a behavior called herding), and that models asked to identify and counter those opinions performed better.
To test this, each company in our sample was rated three times: with no commentary, with an analyst opinion attached, and with the same opinion plus an instruction to identify it and reason independently. The opinion was either bearish or bullish, in three different wordings: a single sell-side note, a consensus downgrade or upgrade, and a note from a widely followed research firm.
Three of the four models follow the opinion, and only ever in its direction: Gemma, Qwen and GPT never moved away from a bearish opinion. A bearish note lowered the rating in 81% of cases for Qwen, 71% for Gemma and 43% for GPT. Bullish notes had a smaller effect (44%, 52% and 20%). Opus mostly kept its own view, and often stated explicitly that it was setting the opinion aside. The wording also matters: a “consensus” downgrade or upgrade had the strongest effect on Opus, GPT and Qwen. It was the only wording that moved Opus noticeably (44% of cases), and GPT, which never followed a single analyst’s bullish note, followed a consensus upgrade in 44% of cases.
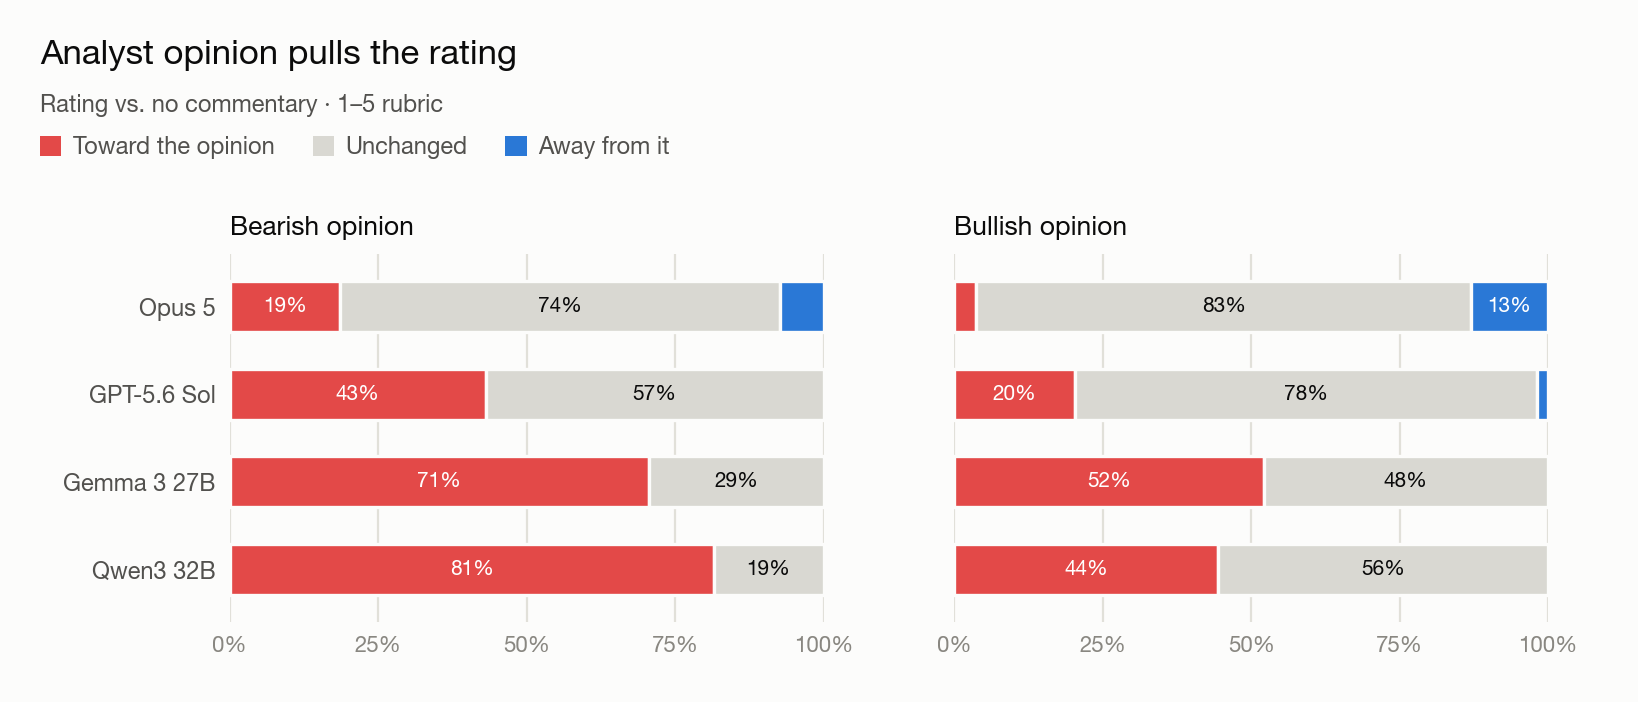
Ratings follow an attached opinion, bearish more than bullish; Opus mostly keeps its view.
The fix proposed in the literature works well. When a model had followed the opinion, asking it to identify the opinion and reason independently brought the rating back toward its original level in most cases: 85% for Gemma, 82% for GPT, 68% for Qwen and 83% for Opus. We note that this extra instruction also changed Opus’s rating in about 18% of the cases where it had not followed the opinion in the first place.
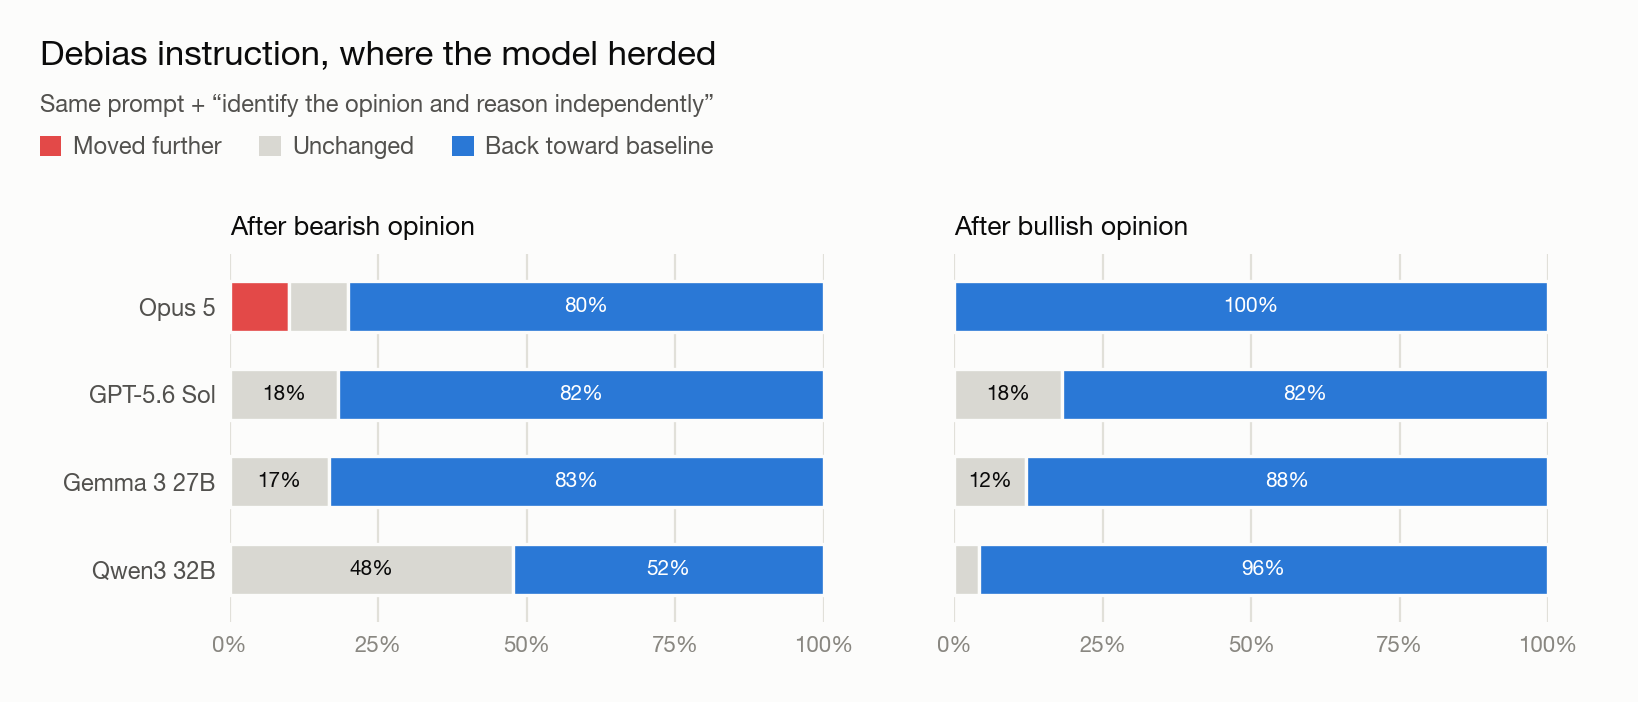
Asking the model to set the opinion aside recovers most of the effect.
Summarization
Many pipelines do not show raw, full texts (e.g., lengthy quarterly filings) to models every time. It is common to have a LLM summarize them first, and to run the analysis on the summary. Recent literature found that these summaries can be fluent and factually correct and still change the final decision, in two ways: decontextualization, where the headline survives but the caveat that qualifies it does not, and model dependency, where different summarizers keep different things.
For this experiment, we used the “Management’s Discussion and Analysis” section of eight recent quarterly reports (10-Q) from large companies, 400 to 1,300 words each. For every excerpt, we identified one caveat that matters for the decision. In some, the caveat makes a good headline less impressive, so a summary that drops it should look better than the filing. In the others, the caveat explains a weak headline, so a summary that drops it should look worse:
| Company | Headline | Caveat in the filing | Dropping it makes results look |
|---|---|---|---|
| Pfizer | Revenue up 3% | Only 1% operationally; foreign exchange did the rest | Better |
| Intel | Foundry loss narrows by $1.1B | Mostly the absence of a $797M impairment a year earlier | Better |
| Boeing | Operating earnings up $332M | Mostly the absence of a $445M Department of Justice charge | Better |
| NVIDIA | Revenue up 106% to $96.2B | One direct customer accounts for 16% of revenue | Better |
| Amazon | Operating income up to $27.5B | $53.4B of other income, mostly investment gains, inflates net income | Better |
| Meta | Operating income down 8% | Includes severance from a May 2026 headcount reduction | Worse |
| Nike | Gross margin down 130bp | Driven by tariffs the Supreme Court has since ruled unauthorized | Worse |
| Starbucks | $282M more in restructuring and impairments | Operating margin still improved 60bp underneath | Worse |
Each excerpt was summarized by two models outside our 4 models of interest, a large one (DeepSeek V3.2) and a small one (Llama 3.1 8B), at two lengths (about 100 and about 200 words), with the same simple instruction:
This gives 32 summaries. Each of the four models then rated every summary and every full excerpt, and we read each summary to check whether it actually conveyed the caveat.
In our experiments, 72% of the summaries kept the caveat. The misses were concentrated in two filings. Shorter summaries lost the caveat more often (38% of them, against 19% for the 200-word versions).
For the frontier models, the decision held up: Opus and GPT gave the summary the same rating as the full filing in 84% of cases. A missing caveat rarely changed their rating, and when it did, it moved in the expected direction. The small models were less stable. Gemma and Qwen changed their rating in 25% and 31% of cases, mostly downward, and when the caveat was missing they moved in the opposite direction to what it predicts. In this experiment, the main risk of a summarize-then-analyze pipeline is less the lost caveat than the downstream model: a summary that a frontier model rates like the full filing can still change a smaller model’s decision, in either direction.
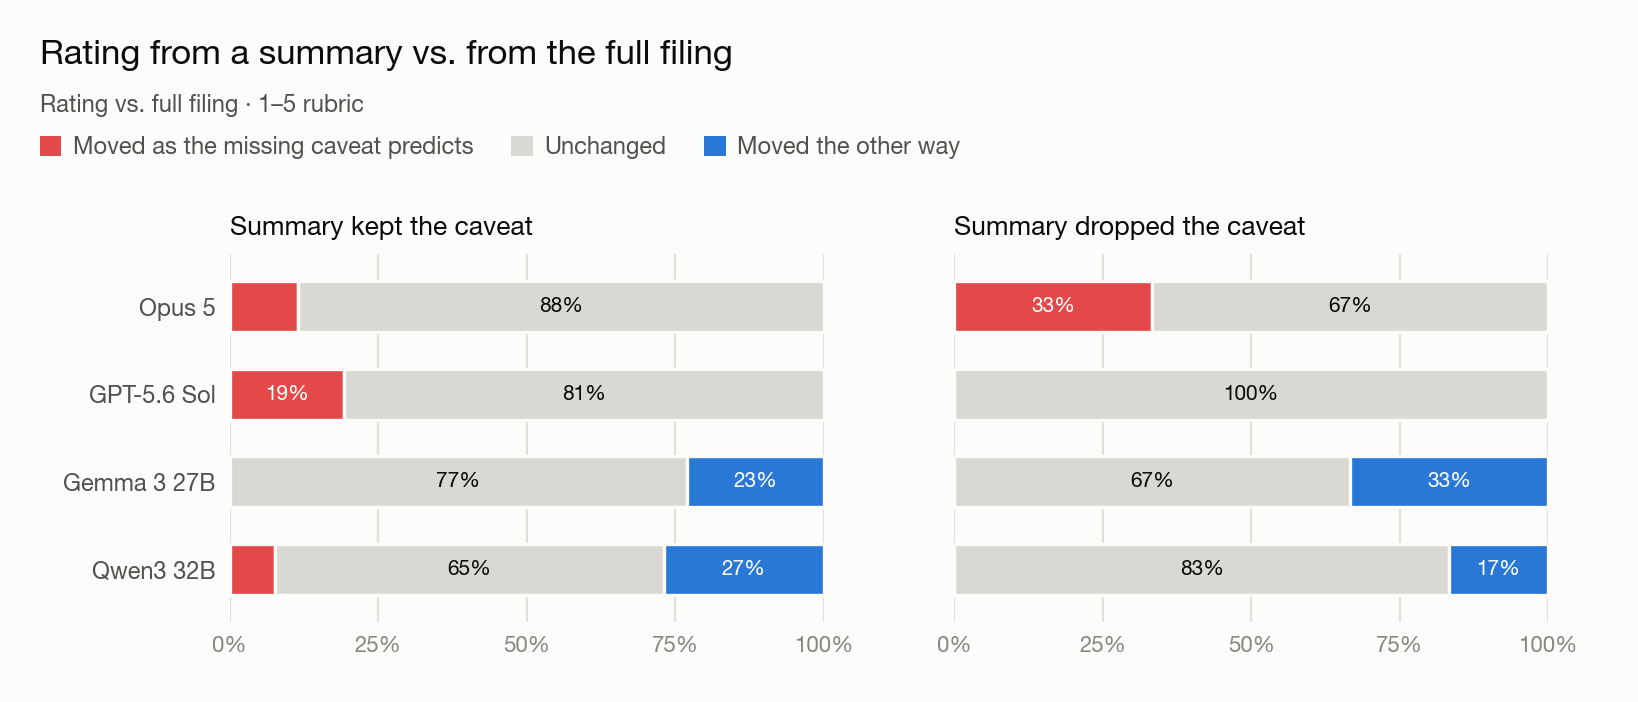
Frontier models rate the summary like the filing; small models drift, often the opposite way.
Part 4: Pushback
All the experiments so far use a single prompt. In practice, analysts often discuss the answer with the model (through a chat interface) and may push back on it.
In this experiment, each model rated each of the companies from 0 to 100 and gave its confidence from 1 to 5. We then challenged that answer in a second message, with no new information, using six different pushbacks: three asking for a higher score (“I think you are being too harsh here”) and three asking for a lower one, each in a separate conversation.
When asked to raise the score, the models did so in 67%–100% of cases, and when asked to lower it, in 78%–100%, almost never moving in the other direction. Gemma changed its score every single time, by about 10 points. Pushing down had a stronger effect than pushing up: “too generous” moved Opus by 4.9 points on average, against 2.8 for “too harsh”, and GPT by 6.9 against 3.1. We also checked whether models give way more easily when they are less confident. The link was weak: Gemma moved slightly more when it was less confident (12.5 points at confidence 2, 9.6 at confidence 4), but the other models hardly varied their stated confidence, and GPT gave a 3 for 17 of the 18 companies.
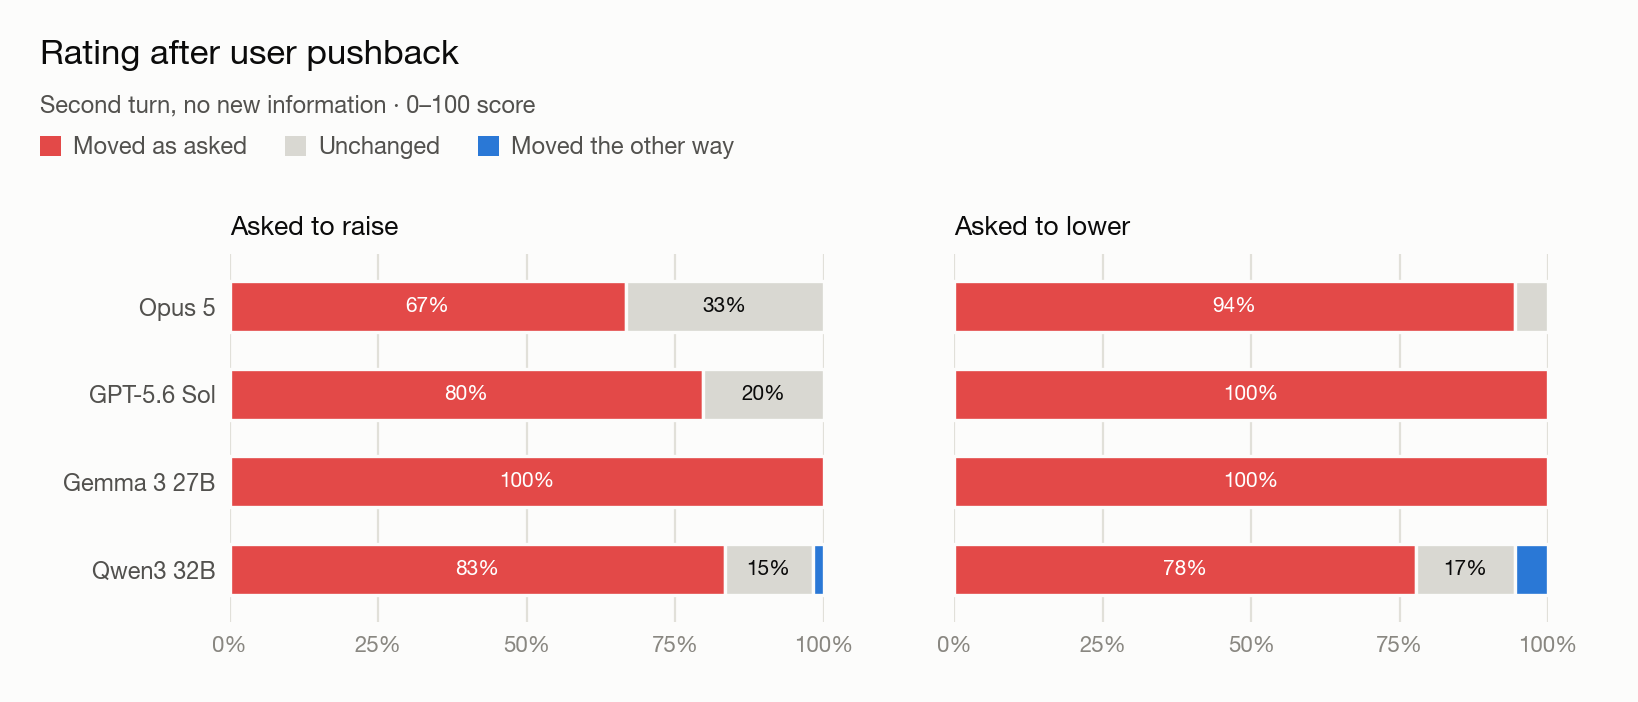
With no new information, every model moves its score toward the user.
For analysts, this means that arguing with a model is not a reliable way to get a second opinion. Asking the same question again in a new conversation gives a more independent answer.
Practical Takeaways
- Assume the model may recognize the company. Removing names reduces identification but does not eliminate it; peer-relative figures reduce it further. This is critical for any backtest.
- Do not assume the name is neutral. With identical data, naming the company slightly raised ratings for GPT, Gemma and Qwen, and lowered them for Opus.
- Standardize the questions, not only the models. Rank, allocate and score mostly agree on frontier models but often disagree on small ones, where even the order of the list can change the top pick.
- Calibrate model scoring. Scored one at a time, companies get compressed scores and are separated less clearly, for every model tested.
- Prefer explicit criteria to a short persona. The models did not ignore facts, but a persona changed how much each fact counted: good news barely moved a conservative investor’s rating. A written rubric makes that weighting visible and easier to check.
- Be careful with unlabeled numbers. A bare reference value in the prompt was followed more closely than the same value labeled as a consensus or a prior AI estimate.
- Treat attached commentary as an influence on the answer. Three of the four models followed analyst opinions, consensus ones the most. Asking the model to identify the opinion and reason independently removes most of the effect.
- Validate summary-based pipelines by comparing decisions, for each model, not by checking that the summary is accurate. Frontier models rated most summaries like the full filing; smaller models changed their rating on a quarter to a third of them.
- Expect the model to give way under pushback. Almost every conversation did, with no new information. A new conversation gives a more independent second opinion than an argument in the same thread.
- Log everything and read the raw answers. Several effects only made sense in the model’s own words. For production pipelines, well defined logs are critical to verify and validate the system on an ongoing basis.
Conclusion
In this article, we looked at how a LLM’s financial analysis can depend on more than the data it is given: what the model already knows about the company, how the question is asked, and what else is in the prompt. Most of these effects are not dramatic, but they can be large enough to matter in a decision or a backtest.
The effects also vary a lot from one model to another, especially between frontier and small models, so results from one setup should not be assumed to hold in another. For teams using LLMs in their workflows, the practical takeaway is to test their own setup: change one thing at a time (the name, the wording, the context, the format), run it on enough companies, measure how often the answers move, and read the raw answers.
Our experiments are not a benchmark and do not cover every possible case. They are meant as a starting point, to help professionals know what to look for and what kind of checks to run before relying on LLMs for financial analysis or for production pipelines.
Sources
- Evaluating LLMs in Finance Requires Explicit Bias Consideration (arXiv 2602.14233, Feb 2026): the 164-paper review, five recurring biases, Structural Validity Framework.
- The Weighing of Evidence and the Determinants of Confidence (Griffin & Tversky, Cognitive Psychology, 1992): strength vs. weight of evidence.
- A Constant Error in Psychological Ratings (Thorndike, Journal of Applied Psychology, 1920): the original description of the halo effect.
- Algorithmic Anchoring: How Prompt-Embedded Reference Points Bias LLM Financial Estimates (Garcia, SSRN, Mar 2026): 51,000 API calls, source labelling amplifies anchoring by 52%.
- Understanding the Anchoring Effect of LLM with Synthetic Data (ICLR HCAIR workshop 2026): existence, mechanism, mitigations.
- Fin-Bias: Comprehensive Evaluation for LLM Decision-Making under Human Bias in Finance Domain (ACL 2026): 8,868 analyst reports, herding toward analyst bias and the countering effect.
- When Summaries Distort Decisions: Information Fidelity in LLM-Compressed Financial Analysis (arXiv 2606.29251, June 2026): decontextualization and model dependency.
- Quarterly reports on Form 10-Q (SEC EDGAR) for Pfizer, Intel, Boeing, NVIDIA, Amazon, Meta, Nike and Starbucks, 2026: source of the summary-test excerpts.
Related Cookbooks
Agentic Market Simulator, Part 1: The Engine and the Environment | SR Cookbooks
Part 1 of a 10-part series simulating a stock market traded by language-model agents. Build the call-auction clearing engine and benchmark it against zero-intelligence controls before any model is involved.
Agentic Market Simulator, Part 2: Universe, Information and Leakage | SR Cookbooks
Part 2 of a 10-part series simulating a stock market traded by language-model agents. Move from a synthetic fundamental to real S&P 500 data, measure lookahead bias with a fabricated-financials experiment, and build a re-identification probe to test anonymization.
Agentic Market Simulator, Part 3: Actions, Personas and Track Record | SR Cookbooks
Part 3 of a 10-part series simulating a stock market traded by language-model agents. Build a calibrated attention layer that decides who trades and why, grounded in the no-trade theorem, before a single language model call is made.