
Agentic Market Simulator Part 6: Policy Design: A Short-Sale Ban
Agentic Market Simulator · Part 6 of 6
This series builds a discrete-time stock market simulator in which the participants are AI agents represented by small language models. Across six episodes of this series we cover the auction system, the information the agents are allowed to see, how they make decisions, what bias is present in language model weights, the agent personas and their memory, the cost of running a large population, and what the finished thing is useful for in practice. It should be understood as a research simulator, not a live trading system.
- 1Engine and Environment
- 2Universe, Information and Leakage
- 3Attention: Who Acts, and Why
- 4Beliefs, Personas and Track Record
- 5Scaling to a Large Number of Agents
- ▸ 6Policy Design: A Short-Sale Banyou are here
TL;DR
This last episode uses the simulator of Episode 5 as a laboratory for policy design. In March 2020, six European countries banned new short positions during the COVID crash; the US did not. We impose the same ban on the simulated market of the 100 largest US companies, from 17 March to 18 May 2020, and compare it with the same market without the ban. In the simulation, the ban reduces trading by about a quarter and makes the market less liquid. These effects directionally agree with what the study of the real 2020 bans found, and the effects on trading and liquidity are close in size to those measured for large companies, although the simulator was never adjusted to reproduce any ban.
This article covers one component of a larger system and makes no claim to replicate a real exchange. Realism will arrive cumulatively across the series: each part is held to its own scope only.
Nothing in this series should be understood as forecasts for prices or investment advice.
Turning the Framework into a Laboratory
We previously ran the simulator at scale: 2,000 agents trading the 100 largest US companies from 2019 to 2022, which produced a market that passes 15 of 19 stylized facts of equity returns. A market that behaves realistically can be used to ask questions that history alone cannot answer. In this episode, we ask one such question: what would a ban on short selling have done to the largest US companies during the COVID crash?
Short selling means selling borrowed shares, in the hope of buying them back later at a lower price. In a crash, regulators often suspect short sellers of pushing prices further down, and may ban new short positions to support prices. In March 2020, six European authorities (Austria, Belgium, France, Greece, Italy and Spain) did so, and lifted their bans on 18 May. The US did not. Studies of these bans, and of those of 2008, mostly find that they made markets less liquid and did not support prices (Beber and Pagano 2013; Boehmer, Jones and Zhang 2013). However, these studies compare different stocks, in different countries and under different rules: they cannot observe the same market with and without the ban.
Since the effects of these bans are known, this question is also a test of the simulator. The aim of this episode is therefore not a new finding on short-sale bans, but to verify that the method works on a case where the results are known.
Experiment
- The market. The simulated market of Episode 5, unchanged: the same companies, agents, information and model. The only difference is the rule.
- The ban. From 17 March to 18 May 2020, on every company, no agent may open a new short position or enlarge an existing one. Existing short positions may be kept or closed.
- Who it binds. Fewer than one agent in ten may sell short: the momentum chasers, who hold both long and short positions, and some of the value quants and retail traders. The ban changes nothing for the others.
- The comparison. Both markets start from the same state on 28 February 2020 and receive the same news. The agents give the same answers in both until the ban changes what they may do, so the two markets are identical until the ban starts.
One difficulty must be addressed before reading any result. When a language model is served in batches, the same question does not always receive exactly the same answer, since the computation depends slightly on the other questions in the batch. Once the ban changes a single answer, the two markets also drift apart for this reason, ban or no ban. To measure that drift, we ran the market without the ban 4 more times from 28 February, with fresh answers from the model. Their spread shows how far two runs differ with no intervention at all, and we read an effect of the ban only when it lies well outside that spread.
What the Ban Did
Short selling
Figure 1 first checks that the rule works as intended. Without the ban, the agents that may short open new short positions worth about 0.02 percent of each company’s float a day (the float is the number of shares available for trading). With the ban, they open none, and short interest falls from 1.38 percent of the float on the eve of the ban to 0.57 percent at its end, against 0.93 percent without the ban. When the ban is lifted, the agents that were held back sell short at once: 20 May brings the largest day of new short sales of the period, 0.22 percent of the float, about twice the largest day without the ban. By the end of June, short interest is back close to its level without the ban.
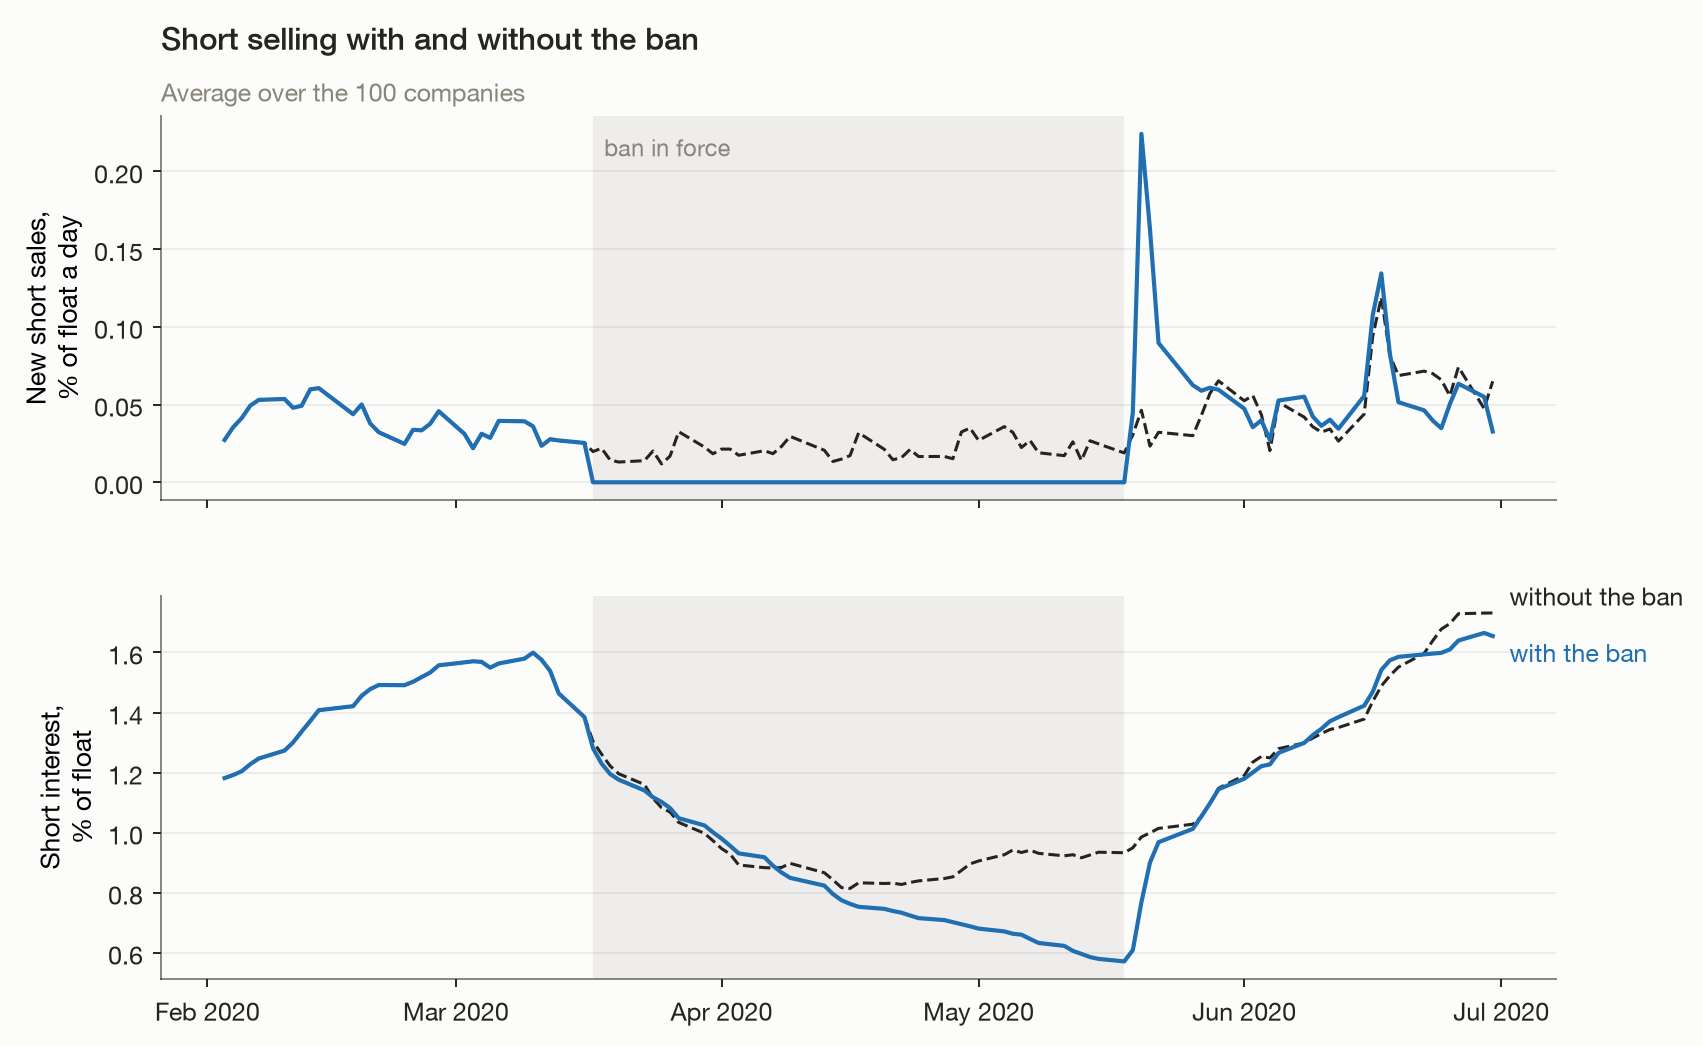
Figure 1. Short selling with and without the ban, averaged over the 100 companies. New short sales stop during the ban and return at once when it is lifted.
Trading, liquidity and prices
Table 1 compares the two markets over the 44 sessions of the ban, next to the spread of the runs without the ban.
| Measure, over the ban | Without the ban | Effect of the ban | Spread without a ban | Reading |
|---|---|---|---|---|
| Trading volume, % of float a day (median company) | 0.21 | −26.0% | +0.7% ± 2.4% | Clear |
| Illiquidity (median company) | 0.14 | +19.7% | −0.5% ± 4.4% | Clear |
| Short interest, % of float (mean) | 0.95 | −12.0% | +5.4% ± 4.1% | Clear |
| Daily volatility, % (median company) | 1.79 | −7.6% | +2.3% ± 4.8% | Suggestive |
| Price delay (median company) | 0.13 | +14.6% | −12.4% ± 15.3% | Within noise |
| Index level at the ban’s end | −3.3% over the ban | +4.1% | +1.1% ± 2.1% | Within noise |
Table 1. Measured over the 44 sessions from 17 March to 18 May 2020. The effect of the ban is the change from the market without it. The spread is the mean and standard deviation of the same change for the 4 runs without the ban, which differ from the market without the ban only by the randomness of the model. Illiquidity is the absolute daily return per million dollars traded (Amihud 2002); price delay is the share of a stock’s moves explained by the market’s past days and not by the same day (Hou and Moskowitz 2005).
The first thing to notice is that the ban reduces trading. The median company’s trading volume falls by 26 percent, while the runs without the ban differ by about 2 percent. All of the lost volume comes from the agents the ban binds.
The second is that the market becomes less liquid. Each dollar traded moves prices 20 percent more, measured by Amihud illiquidity, a standard measure of how much a given amount of trading moves a price. Volatility falls by 8 percent, a result we consider suggestive only, since it lies about two standard deviations from the runs without the ban. The ban also seems to slow down how quickly prices absorb market-wide news, but the runs without the ban vary as much, so we cannot conclude.
The third is that the ban does not support prices, as Figure 2 shows. At the ban’s end, the index is 4 percent higher with the ban than without it. However, the 4 other runs without the ban end between 1 percent below and 4 percent above the first one, from the randomness of the model alone. The ban’s effect on prices therefore cannot be distinguished from noise, and it has almost disappeared by the end of June (+0.8 percent). Nor do the most shorted companies, where a ban should matter most, do better than the least shorted ones.
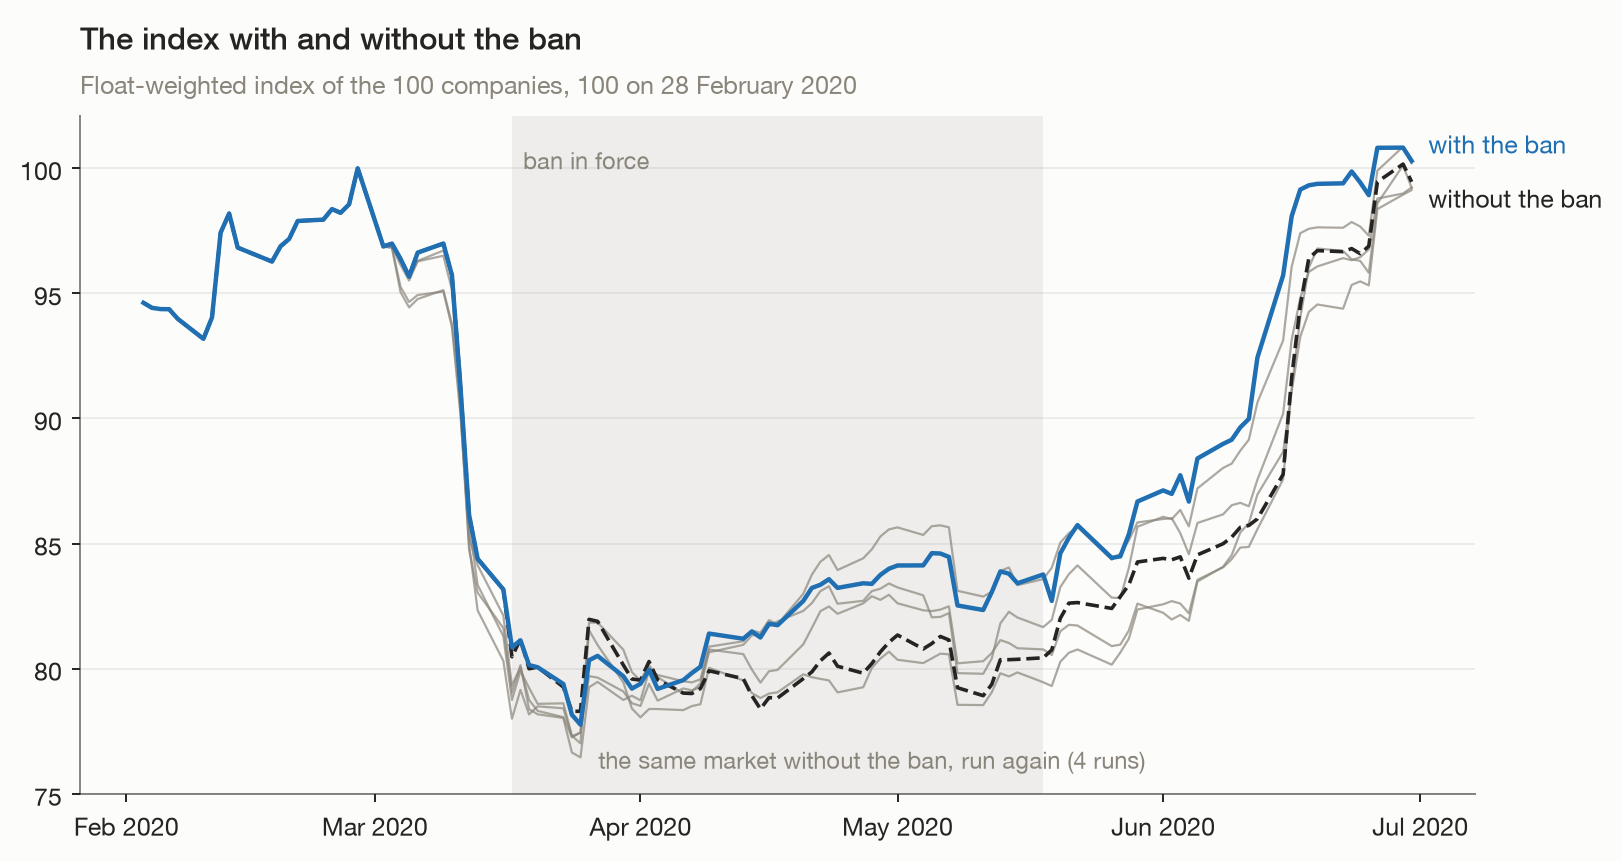
Figure 2. The index with the ban, without it, and in 4 further runs without it (grey). The market with the ban stays within the range of the runs without it.
Against the Real Bans
The simulated market is American and the real bans were European, so there is no real outcome to compare with directly. The closest evidence is the study of the 2020 bans by the European Securities and Markets Authority (ESMA), which compares banned European stocks with similar stocks that were not banned (Spolaore and Le Moign 2023). Table 2 sets the two side by side.
| Effect of the ban | Simulation, US large companies | Real 2020 bans, ESMA |
|---|---|---|
| Trading volume | −26% | −14.9% overall; −31.3% for large companies |
| Illiquidity (Amihud) | +20% | +5.8% overall; +32.7% for large companies |
| Volatility | −8% (suggestive) | −8.4% overall; not significant for large companies |
| Prices | No effect beyond the noise | No significant effect |
| Short positions | Fall, and come back when the ban is lifted | Fall, by 0.52 percent of issued capital |
| Bid-ask spreads | Not measured (daily auction) | +8% overall; +15.9% for large companies |
Table 2. The real effects are those ESMA estimated for banned stocks against similar unbanned stocks (Spolaore and Le Moign 2023). Large companies are the closest comparison, since our universe is made of them.
In direction, the simulation reproduces the main effects the real study measured: less trading, a less liquid market, fewer short positions, and no support for prices. In size, the fall in trading volume and the loss of liquidity are close to what ESMA measured for large companies, which is what our universe is made of. Volatility is less clear: the real bans lowered it overall, but not significantly for large companies, so the suggestive fall in the simulation should not be read as an agreement. Studies of the 2008 bans reach similar conclusions on liquidity and prices (Beber and Pagano 2013; Boehmer, Jones and Zhang 2013).
We note that the simulator was never adjusted to reproduce a ban, and the ban reaches the agents only through what they are allowed to trade. While a single study cannot establish that the simulator responds realistically to every policy, this agreement suggests that it can be useful to explore such questions before a rule is put in place.
What a Simulator Adds
- The same market, with and without the rule. Empirical studies compare banned and unbanned stocks across countries and periods. The simulation compares the same market, on the same days, with the same news, and differs only by the rule and by a randomness we can measure.
- A visible mechanism. We can see which agents trade less and when, and every decision can be read in the agent’s own words.
- No reaction written in advance. Agent-based models have studied short-sale constraints before, with traders that follow simple rules on a synthetic asset (Anufriev and Tuinstra 2013). Our agents follow no rule for how to react to a ban: the ban only limits what they may trade, and their response comes from their own reading of the companies and the news.
- Before the fact. A rule can be tested before it is imposed, on other periods or companies, or in other forms, such as a ban on some companies only or a longer ban.
Limitations
As in Episode 5, the simulator presented here is a deliberately simplified version. The main limitations of this study are:
- No bid-ask spread. The simulated market clears in a daily auction, so the main measure of the real studies cannot be computed.
- Large companies only. The real bans affected small companies differently, which our universe cannot show.
- A US market under a European rule. There is no real outcome of a US ban in 2020 to check the simulation against.
- Few runs. One run with the ban against 4 without it. Effects close to the noise, such as the fall in volatility, remain suggestive.
- Who may short. The size of the effects depends on the share of agents allowed to sell short.
Closing the Series
This episode closes the series. Over six episodes, we built a stock market simulator whose participants are language-model agents: an auction that sets prices (Episode 1), the information the agents may see without seeing the future (Episode 2), who acts and when (Episode 3), how a model’s reading becomes a belief (Episode 4), a run at scale that reproduces most stylized facts of equity returns (Episode 5), and, in this episode, its use to test a policy. We hope it shows that markets of language-model agents can be a useful tool to ask “what if” questions, as long as their results are read with their limits and their noise in mind.
Work with us
Would you like a production or business version of this simulator: on your own universe of assets, with your own data or models, or to test your own policies and scenarios? We would be glad to discuss it.
Contact usReferences
- Spolaore & Le Moign, “Market impacts of the 2020 short selling bans”, Journal of Financial Research (2023), and ESMA Working Paper No. 1 (2024): the measured effects of the 2020 European bans, quoted from the working paper.
- Beber & Pagano, “Short-selling bans around the world: evidence from the 2007–09 crisis”, Journal of Finance (2013): bans reduced liquidity and did not support prices.
- Boehmer, Jones & Zhang, “Shackling short sellers: the 2008 shorting ban”, Review of Financial Studies (2013): the 2008 US ban on financial stocks and its effect on market quality.
- Amihud, “Illiquidity and stock returns: cross-section and time-series effects”, Journal of Financial Markets (2002): the illiquidity measure.
- Hou & Moskowitz, “Market frictions, price delay, and the cross-section of expected returns”, Review of Financial Studies (2005): the price delay measure.
- Anufriev & Tuinstra, “The impact of short-selling constraints on financial market stability in a heterogeneous agents model”, Journal of Economic Dynamics and Control (2013): short-sale constraints in a rule-based agent model.
Related cookbooks
Agentic Market Simulator, Part 5: Scaling to a Large Number of Agents
Part 5 of a 6-part series simulating a stock market traded by language-model agents. Run 2,000 agents on the 100 largest US companies from 2019 to 2022 and judge the simulated market against the stylized facts of equity returns.
Agentic Market Simulator, Part 4: Beliefs, Personas and Track Record
Part 4 of a 6-part series simulating a stock market traded by language-model agents. Turn a model's probabilities over return bins into a valuation and a conviction, show personas react as described, and run a 22-agent market for a simulated year.
Agentic Market Simulator, Part 3: Actions, Personas and Track Record
Part 3 of a 6-part series simulating a stock market traded by language-model agents. Build a calibrated attention layer that decides who trades and why, grounded in the no-trade theorem, before a single language model call is made.